A/B Test(1): A Result Analysis Case
Source Code of this blog.
Introduction
A/B testing is a widely adopted technique in the commercial field to compare two or more groups’ performance and decide which one is better or the best. With the purpose of better understanding the A/B test, I found a real-life dataset and conduct a complete A/B test result analysis.
The dataset is generated from Cookie Cats, a mobile puzzle game from Tactile Entertainment several years ago. The game was a classic type of ‘connect three’ game: when players connect three blocks of the same color, the blocks are cleared. And once all the blocks are cleared on the screen, the player enters the next level. When players reach a certain level, they will have to wait a certain time to unlock the next level, or they make purchases. The company is deciding whether to set the in-app purchase level at 30 or 40. So they set up an A/B test to decide which level benefits more in terms of the game round and retention: a similar number of customers were assigned to level 30 and level 40 respectively and randomly, and after some time, the two groups’ game rounds, 1-day retention and 7-day retention of each player are documented.
To analyze the result, I first do a descriptive analysis for the three metrics. Then for the game rounds, the non-parametric test is used to statistically decide which group has the larger number. For 1-day retention and 7-retention, bootstrapping, i.e., repetitive sampling from the result set, is conducted to measure and compare the result.
Data Description
The dataset contains information of 90189 players’ records without null values, among which 44700 users were assigned to level_30 group randomly, 45489 users were assigned to level 40. Following is a screenshot of the first few rows from the dataset:
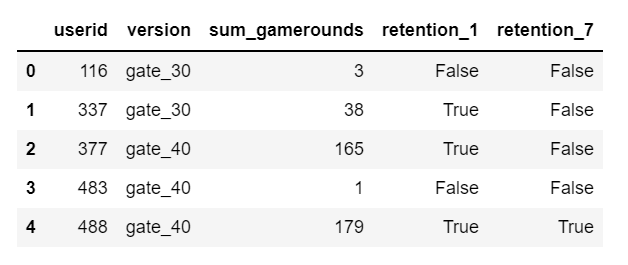
Where userid indicates a unique user number; version of gate_30 indicates the user was assigned to the group of encountering in-app purchases at level 30. The assignment happens when she/he installs the app. Same assignments apply to gate_40; sum_gamerounds refers to the total number of game rounds the user played during the first week after installing the app; rentention_1 refers to whether the user played the game 1 day after installation; retention_7 refers to whether the user played the game 7 days after installation.
Model Development, Estimation and Results
Analysis of Game Round - EDA
Firstly, the descriptive analysis gives an overview of the game round data, I first do a 5-number summary for the level_30 and level_40 group
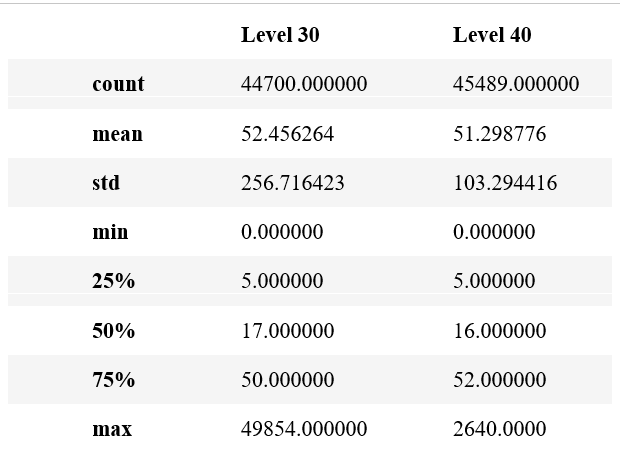
The mean of the two groups does not differ much, but the standard deviation of the level 40 group is almost half of the level 30 group, indicating less variation. And for both groups, there is a huge play round gap between 75 percentile of users and 100 percentile of users, which also can be shown from the boxplot of play rounds of the 2 groups:
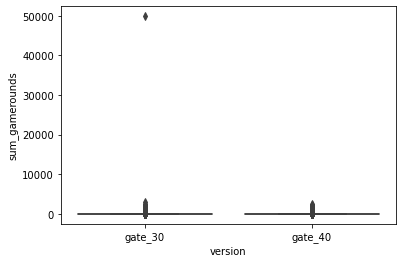
It is clear for level_30, there is an outlier—an addictive player who contributed a lot to the game rounds. And when plotting the number of users who play 1 game round to 100 game rounds, we see the number drops very fast:
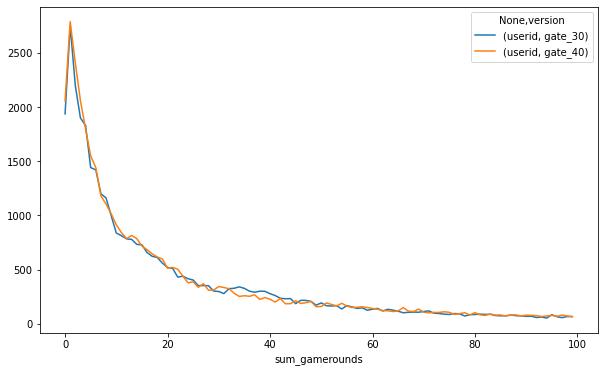
More than 2500 users gave up in the first few rounds for each group and then the trend becomes gentler as the game round increased. The 2 groups perform similarly as the two lines stick to each other.
Why is that happening? A first guess is the nature of app store downloading: the data is recorded for every user who downloaded the app, which means there might be some users mistakenly click the download button, or some users don’t research thoroughly before they download and after a few rounds’ test they gave up the game. Another guess would be the nature of the game industry: after users play sometime, the game content is fully exploited and the user lifetime comes to an end naturally. However, further investigation could be made based on the needs of the company.
Analysis of Game Round - Statistical Test
Next, I performed a statistical test to decide there is a significant difference in the game rounds of the two groups. I checked the distribution of game rounds of two groups by Shaprio-Wilk test, a test of normality with a null hypothesis as ‘the data is normally distributed’ and alternative hypothesis as ‘the data is not normally distributed’. The two groups both give p-value of 0.0, indicating we have enough evidence to reject null hypothesis and conclude the distribution is non-normal. Then I conducted Man-Whitney U test, a non-parametric test with similar usages of two-sample t-test, to see if there’s a significant difference between the 2 groups:
$$ H_0: Level \space 30 \space has \space smaller \space or \space equal \space mean \space play \space rounds \space than \space Level \space 40 \space group$$
$$ H_1: Level \space 30 \space group \space has \space a \space larger \space mean \space play \space rounds \space than \space Level \space 40 \space group $$
And the test result gives a p-value of 0.025, indicating we have enough evidence to reject the null hypothesis and level 30 group has a larger mean play rounds – if the company wants users to play more rounds of the game, they should set the level at 30.
Analysis of Retention - EDA
Similarly I first look at the descriptive data of retention:
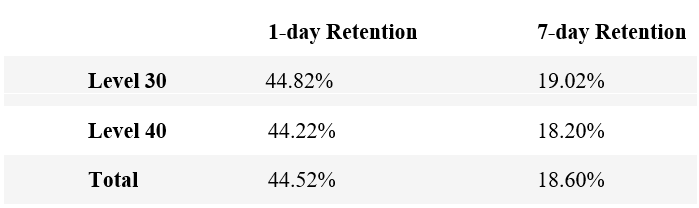
Again the two groups do not appear to differ much. But the 7-day retention is much lower than the 1-day retention generally, which is reasonable by the nature of the simple game: not many players will keep on ‘connecting and clearing’ for 7 days.
Analysis of Retention - Bootstrap
Since the difference between the 2 groups is small, I re-sampled the result set by bootstrapping: repetitive sample from a small dataset with replacement to create many simulations. By these simulations, the sample statistics are more accurate using averages, and with more statistics like standard errors, the confidence interval can be calculated.
For 1-day retention, I bootstrapping-in other words, randomly re-sample the 2 groups 1000 times, and plot the bootstrap distribution:
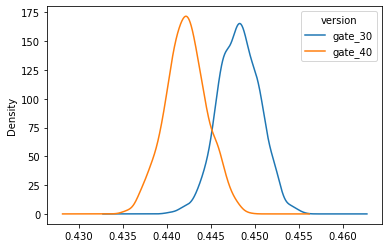
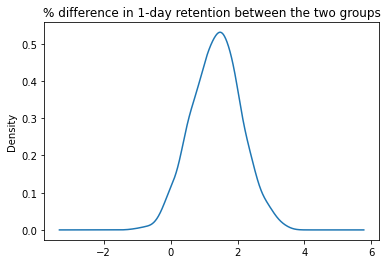
It can be seen clearly from first plot, the bootstrapping gives partly overlapping results of the two groups. From second plot, the distribution of the difference of the bootstrapping result is plotted. It can be viewed similarly to the confidence interval of difference and indicating the 2 groups have a difference in retention rate, where level 30 has a higher retention rate.
Similar analysis is conducted for the 7-day retention and like with the 1-day retention, the difference is obvious and the level-30 group has better retention.
Conclusion
For both retention and sum of game rounds, setting in-app purchase gate at level 30 has a better performance compared to level 40 if we want more customers to stay and play more rounds. There might be several reasons behind that: first, players get bored easily in such a simple game, so they are more bearable of watching long ads at earlier stages. When long ads or purchases happen in the later phase, they would simply quit. Secondly, as the descriptive analysis shows, most people are light players who only play a few rounds—a reasonable guess is that many users cannot reach level 30 or level 40 in such a few rounds, so only loyal players participated in the experiment. These players dive deeper and deeper into the game as level up, and an interruption at later stage harm more than an interruption in an earlier one.
Besides, setting an early stage of ads watching is more convincing for ad providers—so it is a win-win decision.
There would be improvements in my analysis.
- For example, there are obvious outlier data for both groups, and these positive outliers may be very important customers to a game company. The company may wish to analyze and interview these customers separately, rather than putting them in the experiment. The data is skewed because of these outliers, so maybe analyzing after removing these users reveals a more general result.
- Similarly, it would be helpful to divide customers into different cohorts according to their gaming habits and biographical features and conduct another A/B test.
- Next, other important metrics, such as customer lifetime value, can be added to the test to give a comprehensive picture.
- Furthermore, the A/B test is a one-time test. In the long term, repetitive experiments should be conducted to eliminate occasionality and track long-term customer behavior.